Fig. 1: SARS-CoV-2-specific responses in patients recovered from COVID-19.
From: SARS-CoV-2-specific T cell immunity in cases of COVID-19 and SARS, and uninfected controls
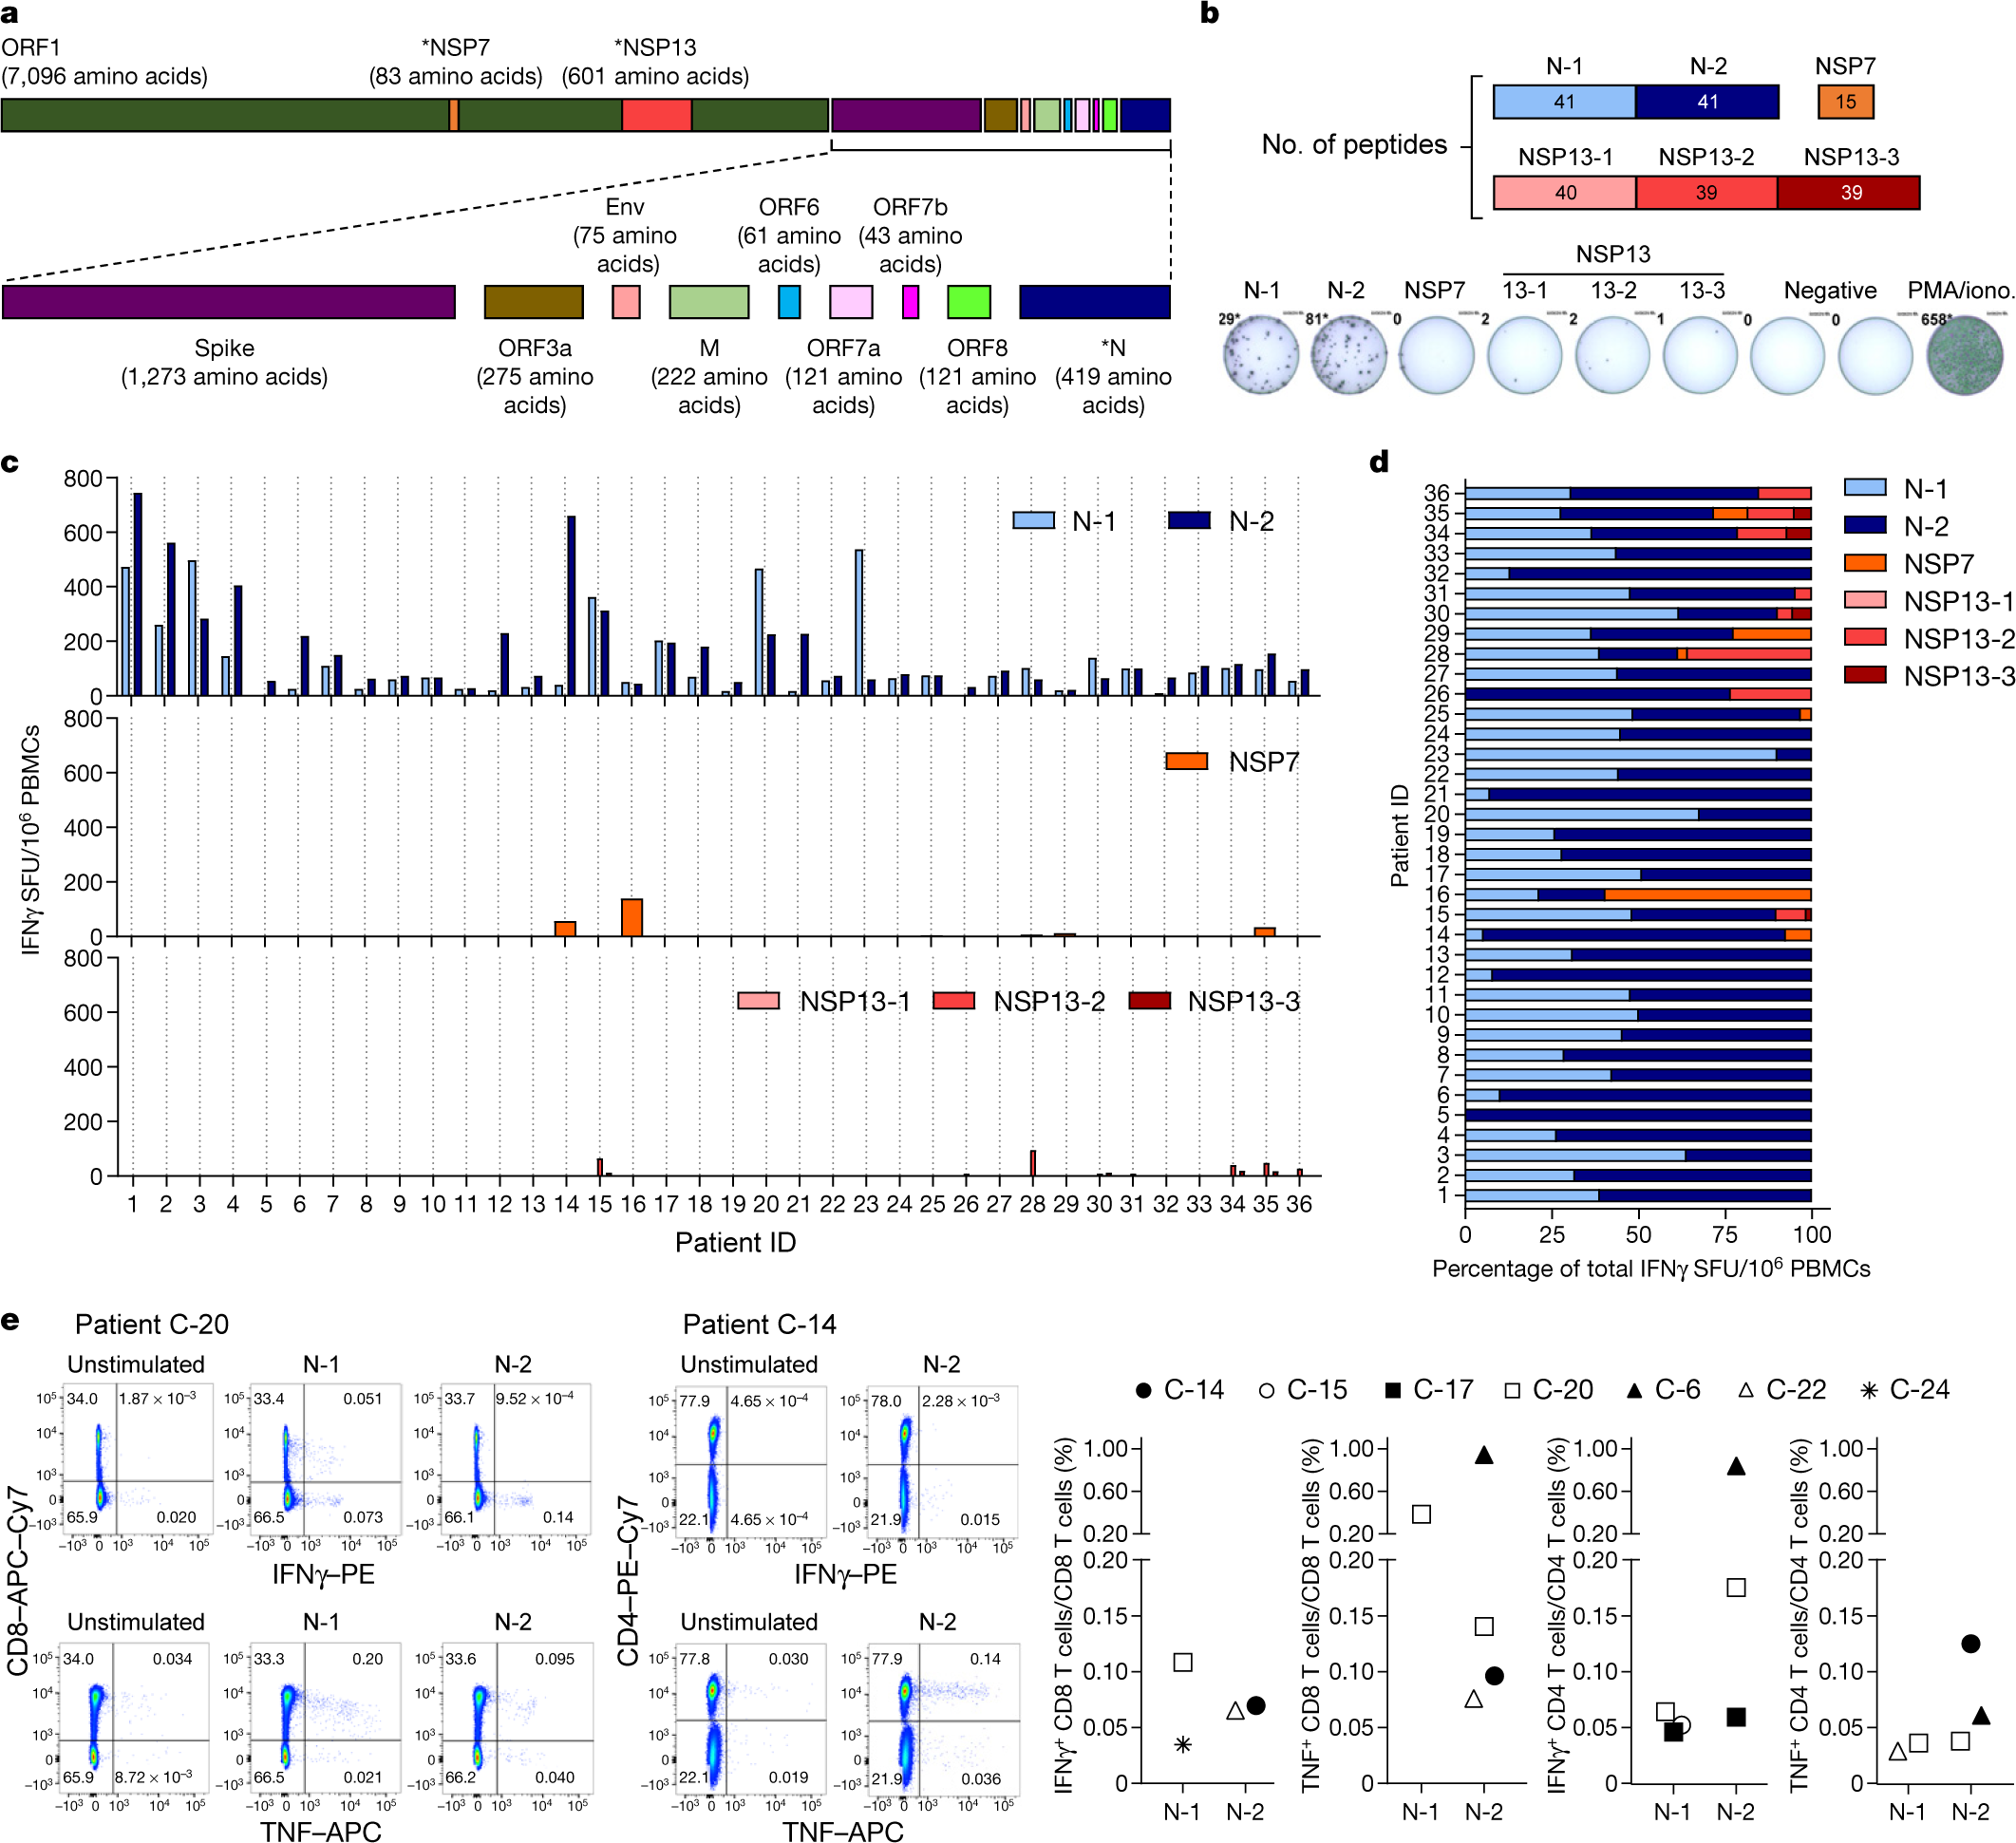
a, SARS-CoV-2 proteome organization; analysed proteins are marked by an asterisk. b, The 15-mer peptides, which overlapped by 10 amino acids, comprising the N protein, NSP7 and NSP13 were split into 6 pools covering the N protein (N-1, N-2), NSP7 and NSP13 (NSP13-1, NSP13-2, NSP13-3). c, PBMCs of patients who recovered from COVID-19 (n = 36) were stimulated with the peptide pools or with phorbol 12-myristate 13-acetate (PMA) and ionomycin (iono) as a positive control. The frequency of spot-forming units (SFU) of IFNγ-secreting cells is shown. d, The composition of the SARS-CoV-2 response in each individual is shown as a percentage of the total detected response. N-1, light blue; N-2, dark blue; NSP7, orange; NSP13-1, light red; NSP13-2, red; NSP13-3, dark red. e, PBMCs were stimulated with the peptide pools covering the N protein (N-1, N-2) for 5 h and analysed by intracellular cytokine staining. Dot plots show examples of patients (2 out of 7) that had CD4 and/or CD8 T cells that produced IFNγ and/or TNF in response to stimulation with N-1 and/or N-2 peptides. The percentage of SARS-CoV-2 N-peptide-reactive CD4 and CD8 T cells in n = 7 individuals are shown (unstimulated controls were subtracted for each response).
Source data
From: SARS-CoV-2-specific T cell immunity in cases of COVID-19 and SARS, and uninfected controls
a, SARS-CoV-2 proteome organization; analysed proteins are marked by an asterisk. b, The 15-mer peptides, which overlapped by 10 amino acids, comprising the N protein, NSP7 and NSP13 were split into 6 pools covering the N protein (N-1, N-2), NSP7 and NSP13 (NSP13-1, NSP13-2, NSP13-3). c, PBMCs of patients who recovered from COVID-19 (n = 36) were stimulated with the peptide pools or with phorbol 12-myristate 13-acetate (PMA) and ionomycin (iono) as a positive control. The frequency of spot-forming units (SFU) of IFNγ-secreting cells is shown. d, The composition of the SARS-CoV-2 response in each individual is shown as a percentage of the total detected response. N-1, light blue; N-2, dark blue; NSP7, orange; NSP13-1, light red; NSP13-2, red; NSP13-3, dark red. e, PBMCs were stimulated with the peptide pools covering the N protein (N-1, N-2) for 5 h and analysed by intracellular cytokine staining. Dot plots show examples of patients (2 out of 7) that had CD4 and/or CD8 T cells that produced IFNγ and/or TNF in response to stimulation with N-1 and/or N-2 peptides. The percentage of SARS-CoV-2 N-peptide-reactive CD4 and CD8 T cells in n = 7 individuals are shown (unstimulated controls were subtracted for each response).
Source data